Two popular dividend-focused ETFs are the Schwab U.S. Dividend Equity ETF (SCHD) and the Vanguard Dividend Appreciation ETF (VIG), but they differ more than you may realize. Let's compare them.
First, note that I don't chase dividends. But I recognize that many investors use dividends to supplement their current income, particularly in retirement. Others just irrationally prefer dividend-paying stocks. I even designed a dividend-focused portfolio for income investors. In any case, SCHD and VIG are very popular and take a pretty different approach. Here we'll review these dividend ETFs and explore the differences between them.
Disclosure: Some of the links on this page are referral links. At no additional cost to you, if you choose to make a purchase or sign up for a service after clicking through those links, I may receive a small commission. This allows me to continue producing high-quality content on this site and pays for the occasional cup of coffee. I have first-hand experience with every product or service I recommend, and I recommend them because I genuinely believe they are useful, not because of the commission I may get. Read more here.
In a hurry? Here are the highlights:
- SCHD and VIG are two popular dividend-oriented ETFs from Schwab and Vanguard, respectively.
- SCHD launched in 2011 and VIG launched in 2006.
- Both are very affordable with the same fee of 0.06%.
- Both are very popular and have significant AUM, but VIG is more popular than SCHD.
- SCHD looks for high-quality companies with a sustainable dividend via profitability screens.
- VIG is comprised of dividend growth stocks, companies with a historically increasing dividend over the past 10 years.
- Both funds exclude REITs.
- Since SCHD's inception in 2011, it has delivered a higher return than VIG with slightly higher volatility.
- These two funds have delivered the same risk-adjusted return.
- As we'd probably expect, SCHD delivers slightly greater exposure to equity risk factors like Value, Profitability, and Investment.
- Dividend investing on the whole is largely rooted in the Value, Profitability, and Investment factors, with somewhat naive exposure to them.
- I created a dividend-focused portfolio that incorporates both of these funds that can be found here.
Contents
Video
Prefer video? Watch it here:

SCHD vs. VIG – Methodology
SCHD is the Schwab U.S. Dividend Equity ETF. It tracks the Dow Jones U.S. Dividend 100™ Index. This index is comprised of 100 stocks with at least 10 consecutive years of dividend payments and a minimum market cap of $500 million. Stocks are then selected for the index by screening for yield, profitability and cash flow metrics, and projected dividend growth. This fund excludes REITs. Individual companies are capped at 4% and sectors at 25%.
VIG, the Vanguard Dividend Appreciation ETF, is comprised of dividend growth stocks – companies with a history of an increasing dividend over time. Specifically, VIG tracks the S&P U.S. Dividend Growers Index. This index was created in 2006, and is comprised of companies with at least 10 consecutive years of an increasing dividend payment. The index It is reconstituted annually. Like SCHD, VIG caps individual holdings at 4%.
Thanks to its earnings screens, SCHD has a tiny bit more loading on the Value, Profitability, and Investment factors. VIG actually has slight negative loading on Value.
Of importance to yield chasers is the fact that SCHD also has a considerably higher dividend yield than VIG.
SCHD vs. VIG – Sector Composition
| SCHD | VIG | |
| Basic Materials | 2.8% | 4.8% |
| Consumer Staples | 14.7% | 13.9% |
| Consumer Discretionary | 7.5% | 8.7% |
| Financials | 19.6% | 14.5% |
| Healthcare | 13.1% | 15.8% |
| Industrials | 15.8% | 12.9% |
| Energy | 5.9% | 0.1% |
| Technology | 14.9% | 23.4% |
| Telecommmunications | 5.4% | 2.0% |
| Utilities | 0.4% | 3.2% |
| Real Estate | 0.0% | 0.0% |
Notice how SCHD has roughly zero exposure to Utilities and VIG has roughly zero exposure to Telecom and Energy. Both funds exclude REITs. Specifically, SCHD and VIG only have about 17% overlap by weight.
SCHD vs. VIG – Performance Backtest
Both SCHD and VIG are highly liquid and have the same low expense ratio of 0.06%. Here's a performance backtest of these two funds going back to SCHD's inception in 2011:
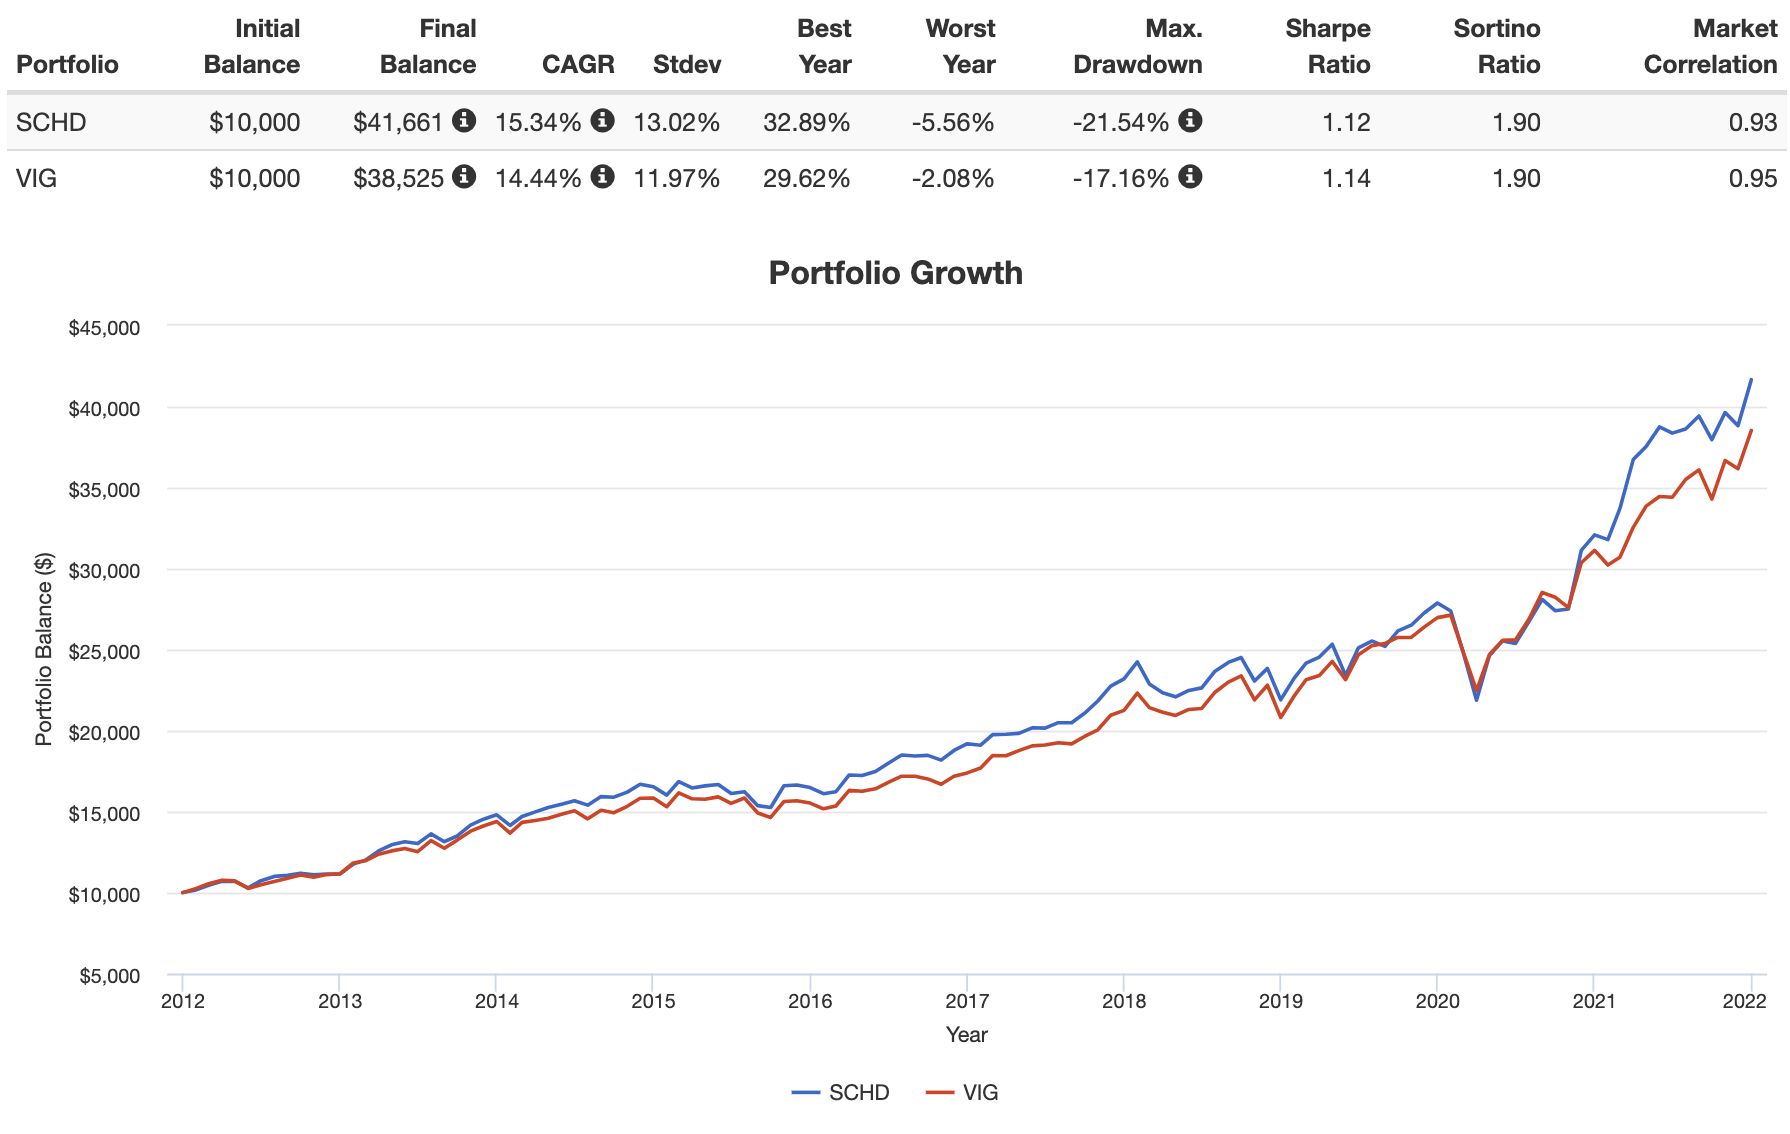
SCHD has slightly outperformed VIG basically the entire time over the backtested time period, particularly in recent years, though these 2 funds delivered an identical risk-adjusted return, as VIG exhibited lower volatility and a smaller max drawdown, which was the March 2020 crash.
SCHD vs. VIG – Conclusion
I created a dividend-focused portfolio that incorporates both of these funds that can be found here.
But remember what I noted in my comparison of VIG and VYM: Vanguard themselves investigated the strategies of funds like these and concluded that their constituent stocks’ performance was fully explained by their exposure to known equity factors like Value, Profitability, etc., so if you don't care about using dividends as income, you may be better off – in terms of total return – by simply investing in products that specifically target those factors, like a small cap value fund.
Keep in mind too that in choosing one of these funds, you may be missing out on some sectors entirely, like REITs for example, which are usually coveted by yield chasers.
Conveniently, both SCHD and VIG should be available at any major broker, including M1 Finance, which is the one I'm usually suggesting around here.
Do you hold either of these ETFs in your portfolio? Let me know in the comments.
Disclaimer: While I love diving into investing-related data and playing around with backtests, this is not financial advice, investing advice, or tax advice. The information on this website is for informational, educational, and entertainment purposes only. Investment products discussed (ETFs, mutual funds, etc.) are for illustrative purposes only. It is not a research report. It is not a recommendation to buy, sell, or otherwise transact in any of the products mentioned. I always attempt to ensure the accuracy of information presented but that accuracy cannot be guaranteed. Do your own due diligence. I mention M1 Finance a lot around here. M1 does not provide investment advice, and this is not an offer or solicitation of an offer, or advice to buy or sell any security, and you are encouraged to consult your personal investment, legal, and tax advisors. Hypothetical examples used, such as historical backtests, do not reflect any specific investments, are for illustrative purposes only, and should not be considered an offer to buy or sell any products. All investing involves risk, including the risk of losing the money you invest. Past performance does not guarantee future results. Opinions are my own and do not represent those of other parties mentioned. Read my lengthier disclaimer here.

Are you nearing or in retirement? Use my link here to get a free holistic financial plan and to take advantage of 25% exclusive savings on financial planning and wealth management services from fiduciary advisors at Retirable to manage your savings, spend smarter, and navigate key decisions.

Leave a Reply